NASDAQ Corrections: An Opportunity For traders To Profit?

Market corrections are a natural part of market cycles, often causing unease among investors. However, with a strategic approach, these corrections could present significant opportunities for traders. In this short post I want to explore the concept of market corrections, specifically focusing on the NASDAQ QQQ ETF, and delve into some data supporting a potentially profitable scenario that we are presented with today.
A market correction is typically defined as a decline of 10% or more in a stock, bond, commodity, or index from its recent peak. Corrections are a natural part of the market cycle, often caused by economic events, geopolitical tensions, or changes in market sentiment. They serve to adjust overvalued assets back to more sustainable levels. Corrections are different from bear markets, which are characterized by a decline of 20% or more. While bear markets can last for months or even years, corrections are usually shorter, lasting from a few weeks to a few months.
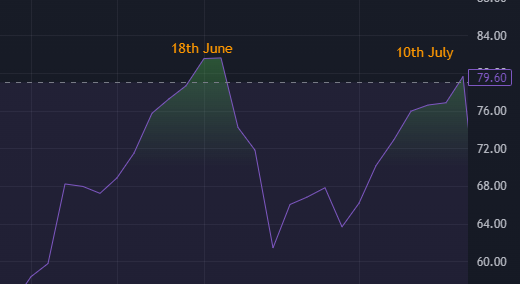
The NASDAQ (QQQ) has been on an absolute tear recently reaching significantly overbought levels measured by a RSI value of over 79 twice in under 2 months and new all time price highs. Levels like this aren’t that common having only happen on 2 other occasions since the COVID crash in 2020.

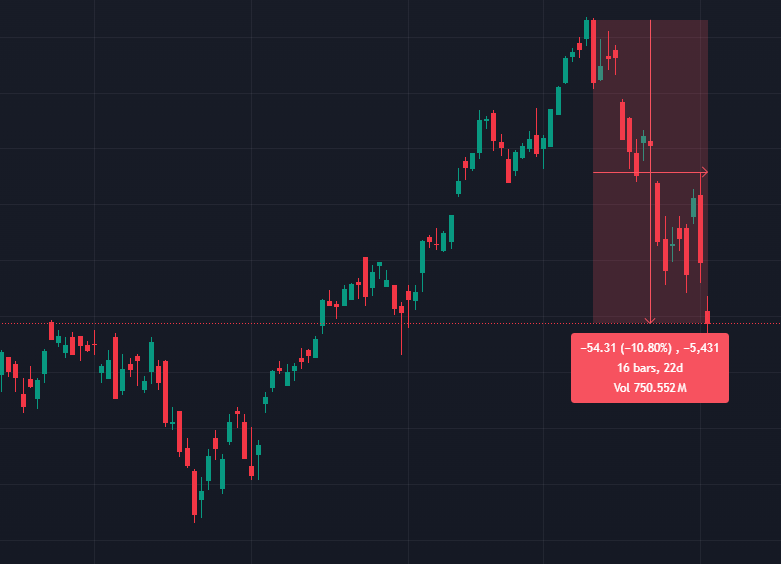
However today (5th Aug 2024) QQQ is currently trading 10% below its recent all-time high achieved on 11th July, placing it in correction territory. So we currently have a good opportunity to explore a somewhat rare “what if”. What if we had systematically brought QQQ as it entered a correction state and sold it a week later? Could this give us any clue what to expect for QQQ’s near term performance after a correction?
Here are the rules for this analysis:
- If QQQ has declined 10% within the last 20 trading days we buy it.
- We sell at market open on the 6th trading day after buying
Results:
- Number of Samples: 17
- Win Rate: 70.59%
- Average Trade: 2.97%
- Net Overall Profit: 60.85%
- Largest winning trade 15.55%
- Largest losing trade 10%
- Max drawdown 39.35%
These stat’s indicate that probability may be on your side when buying QQQ as it tips into a correction state. However you would have to potentially stomach a large drawdown of 39% while holding this trade. This max drawdown came during the dot com crash in 2000 where the market was full of low quality “tech” companies often without revenue or even products! The hype at this time was extreme with business fundamentals almost nonexistent. However fast forwarding to today we see a much healthier tech sector represented by some of the most successful businesses in the world. Because of this I believe we are unlikely to see another tech sector only panic event such as the dot com crash.
So what can we takeaway from this? The key insight here is that market participants often react emotionally during corrections. When the market is down, fear and panic can set in, leading to irrational selling. However, this is precisely when opportunities arise for those who remain rational and strategic. Market corrections are often accompanied by negative news and pessimistic forecasts, causing many investors to sell their holdings. This creates a buying opportunity for those who can look past the short-term noise.
Personally I don’t think this is a tradable strategy as defined above, but it does illustrate the markets tendency to overact in the sort term and may with more analysis and work inspire and viable strategy.


